Log and Results Analysis
Log Analysis
Introduction of log analysis tool
tools/analysis_tools/analyze_logs.py plots curves of given keys according to the log files.
python tools/analysis_tools/analyze_logs.py plot_curve  \
    ${JSON_LOGS}  \
    [--keys ${KEYS}]  \
    [--title ${TITLE}]  \
    [--legend ${LEGEND}]  \
    [--backend ${BACKEND}]  \
    [--style ${STYLE}]  \
    [--out ${OUT_FILE}]  \
    [--window-size ${WINDOW_SIZE}]
Description of all arguments:
json_logs: The paths of the log files, separate multiple files by spaces.--keys: The fields of the logs to analyze, separate multiple keys by spaces. Defaults to ‘loss’.--title: The title of the figure. Defaults to use the filename.--legend: The names of legend, the number of which must be equal tolen(${JSON_LOGS}) * len(${KEYS}). Defaults to use"${JSON_LOG}-${KEYS}".--backend: The backend of matplotlib. Defaults to auto selected by matplotlib.--style: The style of the figure. Default towhitegrid.--out: The path of the output picture. If not set, the figure won’t be saved.--window-size: The shape of the display window. The format should be'W*H'. Defaults to'12*7'.
Note
The --style option depends on seaborn package, please install it before setting it.
How to plot the loss/accuracy curve
We present some examples here to show how to plot the loss curve of accuracy curve by using the tools/analysis_tools/analyze_logs.py
Plot the loss curve in training.
python tools/analysis_tools/analyze_logs.py plot_curve your_log_json --keys loss --legend loss
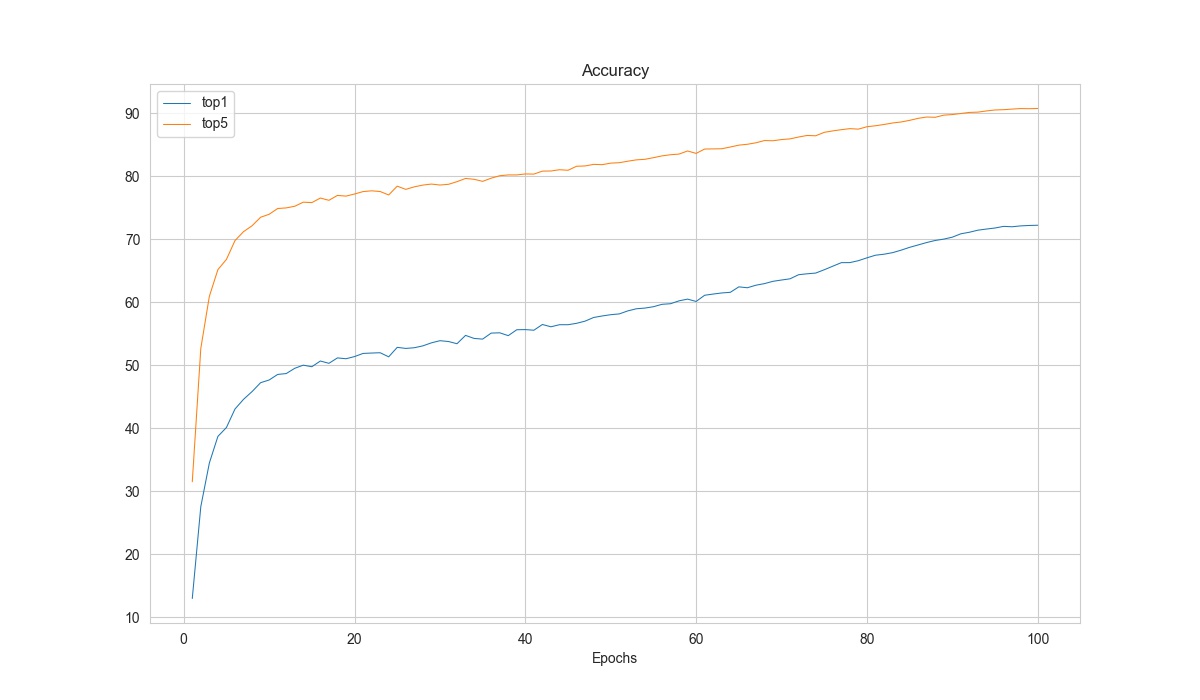
Plot the top-1 accuracy and top-5 accuracy curves, and save the figure to results.jpg.
python tools/analysis_tools/analyze_logs.py plot_curve your_log_json --keys accuracy/top1 accuracy/top5 --legend top1 top5 --out results.jpg
Compare the top-1 accuracy of two log files in the same figure.
python tools/analysis_tools/analyze_logs.py plot_curve log1.json log2.json --keys accuracy/top1 --legend exp1 exp2
How to calculate training time
tools/analysis_tools/analyze_logs.py can also calculate the training time according to the log files.
python tools/analysis_tools/analyze_logs.py cal_train_time \
    ${JSON_LOGS}
    [--include-outliers]
Description of all arguments:
json_logs: The paths of the log files, separate multiple files by spaces.--include-outliers: If set, include the first time record in each epoch (Sometimes the time of the first iteration is longer).
Example:
python tools/analysis_tools/analyze_logs.py cal_train_time work_dirs/your_exp/20230206_181002/vis_data/scalars.json
The output is expected to be like the below.
-----Analyze train time of work_dirs/your_exp/20230206_181002/vis_data/scalars.json-----
slowest epoch 68, average time is 0.3818
fastest epoch 1, average time is 0.3694
time std over epochs is 0.0020
average iter time: 0.3777 s/iter
Result Analysis
With the --out argument in tools/test.py, we can save the inference results of all samples as a file.
And with this result file, we can do further analysis.
How to conduct offline metric evaluation
We provide tools/analysis_tools/eval_metric.py to enable the user evaluate the model from the prediction files.
python tools/analysis_tools/eval_metric.py \
      ${RESULT} \
      [--metric ${METRIC_OPTIONS} ...]
Description of all arguments:
result: The output result file in pickle format fromtools/test.py.--metric: The metric and options to evaluate the results. You need to specify at least one metric and you can also specify multiple--metricto use multiple metrics.
Please refer the Metric Documentation to find the available metrics and options.
Note
In tools/test.py, we support using --out-item option to select which kind of results will be saved.
Please ensure the --out-item is not specified or --out-item=pred to use this tool.
Examples:
# Get the prediction results
python tools/test.py configs/resnet/resnet18_8xb16_cifar10.py \
    https://pub-ed9ed750ddcc469da251e2d1a2cea382.r2.dev/mmclassification/v0/resnet/resnet18_b16x8_cifar10_20210528-bd6371c8.pth \
    --out results.pkl

# Eval the top-1 and top-5 accuracy
python tools/analysis_tools/eval_metric.py results.pkl --metric type=Accuracy topk=1,5

# Eval the overall accuracy and the class-wise precision, recall, f1-score
python tools/analysis_tools/eval_metric.py results.pkl --metric type=Accuracy \
    --metric type=SingleLabelMetric items=precision,recall,f1-score average=None
How to plot the confusion matrix for the test result
We provide tools/analysis_tools/confusion_matrix.py to enable the user plot the confusion matrix from the prediction files.
python tools/analysis_tools/confusion_matrix.py \
      ${CONFIG} \
      ${RESULT} \
      [--out ${OUT}] \
      [--show] \
      [--show-path ${SHOW_PATH}] \
      [--include-values] \
      [--cmap] \
      [--cfg-options ${CFG_OPTIONS} ...] \
Description of all arguments:
config: The config file path.result: The output result file in pickle format fromtools/test.py, or a checkpoint file.--out: The path to save the confusion matrix in pickle format.--show: Whether to show the confusion matrix plot.--show-path: The path to save the confusion matrix plot.--include-values: Whether to show the values in the confusion matrix plot.--cmap: The color map to plot the confusion matrix.--cfg-options: If specified, the key-value pair config will be merged into the config file, for more details please refer to Learn about Configs
Note
In tools/test.py, we support using --out-item option to select which kind of results will be saved.
Please ensure the --out-item is not specified or --out-item=pred to use this tool.
Examples:
# Get the prediction results
python tools/test.py configs/resnet/resnet18_8xb16_cifar10.py \
    https://pub-ed9ed750ddcc469da251e2d1a2cea382.r2.dev/mmclassification/v0/resnet/resnet18_b16x8_cifar10_20210528-bd6371c8.pth \
    --out results.pkl

# Save the confusion matrix in a pickle file
python tools/analysis_tools/confusion_matrix.py configs/resnet/resnet18_8xb16_cifar10.py results.pkl --out cm.pkl

# Show the confusion matrix plot in a graphical window.
python tools/analysis_tools/confusion_matrix.py configs/resnet/resnet18_8xb16_cifar10.py results.pkl --show
How to visualize the prediction results
We can use tools/analysis_tools/analyze_results.py to save the images with the highest scores in successful or failed prediction.
python tools/analysis_tools/analyze_results.py \
      ${CONFIG} \
      ${RESULT} \
      [--out-dir ${OUT_DIR}] \
      [--topk ${TOPK}] \
      [--rescale-factor ${RESCALE_FACTOR}] \
      [--cfg-options ${CFG_OPTIONS}]
Description of all arguments:
config: The path of the model config file.result: Output result file in json/pickle format fromtools/test.py.--out_dir: Directory to store output files.--topk: The number of images in successful or failed prediction with the highesttopkscores to save. If not specified, it will be set to 20.--rescale-factor: Image rescale factor, which is useful if the output is too large or too small (Too small images may cause the prediction tag is too vague).--cfg-options: If specified, the key-value pair config will be merged into the config file, for more details please refer to Learn about Configs
Note
In tools/test.py, we support using --out-item option to select which kind of results will be saved.
Please ensure the --out-item is not specified or --out-item=pred to use this tool.
Examples:
# Get the prediction results
python tools/test.py configs/resnet/resnet18_8xb16_cifar10.py \
    https://pub-ed9ed750ddcc469da251e2d1a2cea382.r2.dev/mmclassification/v0/resnet/resnet18_b16x8_cifar10_20210528-bd6371c8.pth \
    --out results.pkl

# Save the top-10 successful and failed predictions. And enlarge the sample images by 10 times.
python tools/analysis_tools/analyze_results.py \
       configs/resnet/resnet18_8xb16_cifar10.py \
       results.pkl \
       --out-dir output \
       --topk 10 \
       --rescale-factor 10